tidb-in-action
3.1 Sysbench 基准性能测试
TiDB 兼容 MySQL,支持无限的水平扩展,具备强一致性和金融级高可用性,为 OLTP 和 OLAP 场景提供一站式的解决方案。但想要使用 TiDB 时,都会被要求做基准测试并与 MySQL 对比,本文基于 sysbench 工具进行基准测试做简要说明。
3.1.1 工具集方案
- sysbench 安装
mkdir -p /tmp/sysbench cd /tmp/sysbench wget https://github.com/akopytov/sysbench/archive/1.0.14.tar.gz yum -y install make automake libtool pkgconfig libaio-devel yum -y install mariadb-devel ./autogen.sh ./configure make -j make install sysbench --version - 硬件配置
| 项目 | 配置 | 台数 | 说明 |
|---|---|---|---|
| TiDB & PD | CPU:2*E5-2650 v4@2.20GHz 内存:128G 硬盘:2*800G 固态、3*1.6T SSD 网卡:2 * 万兆 做 bond-1 |
3 | TiDB 和 PD 应用部署,文件系统 ext4 |
| TiKV | CPU:2*E5-2650 v4@2.20GHz 内存:256G 硬盘:2*480G 固态、4*1.92T NVMe SSD 网卡:2 * 万兆 做 bond-1 |
3 | TiKV 应用部署,文件系统 ext4,PCIe 盘直接挂载到操作系统目录 |
| monitor | 8 核,32G,800G 硬盘虚拟机 | 3 | 部署:Grafana + Prometheus |
- 环境说明
| 项目 | |
|---|---|
| 操作系统 | Redhat 7.4 |
| TiDB 版本 | TiDB-v3.0.5 |
| TiDB & PD | 每台 “TiDB 服务器” 部署 2 个 tidb-server + 1 个 pd-server |
| TiKV | 每台 “TiKV 服务器” 部署 4 个 tikv-server |
| TiDB 关键参数 | performance: max-procs: 24 |
| TiKV 关键参数 | readpool: coprocessor: high-concurrency: 8 normal-concurrency: 8 low-concurrency: 8 storage: block-cache: capacity: “32GB” |
3.1.2 测试实操
1. 测试准备工作
- sysbench 配置
mysql-host=192.168.xxx.xxx mysql-port=4000 mysql-user=sysbench mysql-password=****** mysql-db=test time=60 threads=16 report-interval=10 db-driver=mysql - sysbench 关键参数说明
--threads=8 表示发起 8 个并发连接 --report-interval=10 表示每 10 秒输出一次测试进度报告 --rand-type=uniform 表示随机类型为固定模式,其他几个可选随机模式:uniform (固定),gaussian (高斯),special (特定的),pareto (帕累托) --time=120 表示最大执行时长为 120 秒 --events=0 表示总请求数为 0,因为上面已经定义了总执行时长,所以总请求数可以设定为 0;也可以只设定总请求数,不设定最大执行时长 --percentile=99 表示设定采样比例,默认是 95%,即丢弃 1% 的长请求,在剩余的 99% 里取最大值 - sysbench 结果解读
sysbench 1.0.14 (using bundled LuaJIT 2.1.0-beta2)
Running the test with following options:
Number of threads: 16
Report intermediate results every 10 second(s)
Initializing random number generator from current time
Initializing worker threads...
Threads started!
# 每 10 秒钟报告一次测试结果,tps、每秒读、每秒写、95% 以上的响应时长统计
[ 10s ] thds: 16 tps: 21532.38 qps: 21532.38 (r/w/o: 21532.38/0.00/0.00) lat (ms,95%): 1.04 err/s: 0.00 reconn/s: 0.00
[ 20s ] thds: 16 tps: 21617.20 qps: 21617.20 (r/w/o: 21617.20/0.00/0.00) lat (ms,95%): 1.01 err/s: 0.00 reconn/s: 0.00
[ 30s ] thds: 16 tps: 21550.98 qps: 21550.98 (r/w/o: 21550.98/0.00/0.00) lat (ms,95%): 1.03 err/s: 0.00 reconn/s: 0.00
[ 40s ] thds: 16 tps: 21544.16 qps: 21544.16 (r/w/o: 21544.16/0.00/0.00) lat (ms,95%): 1.01 err/s: 0.00 reconn/s: 0.00
[ 50s ] thds: 16 tps: 21639.76 qps: 21639.76 (r/w/o: 21639.76/0.00/0.00) lat (ms,95%): 0.99 err/s: 0.00 reconn/s: 0.00
[ 60s ] thds: 16 tps: 21597.56 qps: 21597.56 (r/w/o: 21597.56/0.00/0.00) lat (ms,95%): 1.01 err/s: 0.00 reconn/s: 0.00
SQL statistics:
    queries performed:
        read:                            1294886                        # 读总数
        write:                           0                              # 写总数
        other:                           0                              # 其他操作总数 (COMMIT 等)
        total:                           1294886                        # 全部总数
    transactions:                        1294886 (21579.74 per sec.)    # 总事务数 ( 每秒事务数 )
    queries:                             1294886 (21579.74 per sec.)    # 读总数 ( 每秒读次数 )
    ignored errors:                      0      (0.00 per sec.)         # 忽略错误数 ( 每秒忽略错误数 )
    reconnects:                          0      (0.00 per sec.)         # 重连次数 ( 每秒重连次数 )
General statistics:
    total time:                          60.0029s                       # 总共耗时
    total number of events:              1294886                        # 总共发生多少事务数

Latency (ms):
         min:                                    0.36                   # 最小延时
         avg:                                    0.74                   # 平均延时
         max:                                    8.90                   # 最大延时
         95th percentile:                        1.01                   # 超过 95% 平均耗时
         sum:                               959137.19
Threads fairness:
    events (avg/stddev):           80930.3750/440.48                    # 平均每线程完成 80930.3750 次 event,标准差为 440.48
    execution time (avg/stddev):   59.9461/0.00                         # 每个线程平均耗时 59.9 秒,标准差为 0
- 准备数据
sysbench --config-file=sysbench-thread-16.cfg oltp_point_select --tables=32 --table-size=10000000 prepare - 数据预热与统计信息收集
数据预热可将磁盘中的数据载入内存的 block cache 中,预热后的数据对系统整体的性能有较大的改善,建议在每次重启集群后进行一次数据预热。以表 sbtest1 为例,执行如下 SQL 语句 进行数据预热,命令如下:
SELECT COUNT(pad) FROM sbtest1 USE INDEX(k_1);
统计信息收集有助于优化器选择更为准确的执行计划,可以通过 analyze 命令来收集系列表 sbtest* 的统计信息,每个表都需要收集统计信息,以表 sbtest1 为例,命令如下:
ANALYZE TABLE sbtest1;
2. 测试命令举例
- Point select 测试命令
sysbench --config-file=sysbench-thread-16.cfg oltp_point_select --tables=32 --table-size=10000000 run - Update index 测试命令
sysbench --config-file=sysbench-thread-16.cfg oltp_update_index --tables=32 --table-size=10000000 run - Read-only 测试命令
sysbench --config-file=sysbench-thread-16.cfg oltp_read_only --tables=32 --table-size=10000000 run - Write-only 测试命令
sysbench --config-file=sysbench-thread-16.cfg oltp_write_only --tables=32 --table-size=10000000 run - Read-Write 测试命令
sysbench --config-file=sysbench-thread-16.cfg oltp_read_write --tables=32 --table-size=10000000 run3. 测试结果举例
笔者测试数据 32 张表,每张表有 10MB 数据。对集群所有 tidb-server 都同时进行 sysbench 测试,将结果相加,得出最终结果:
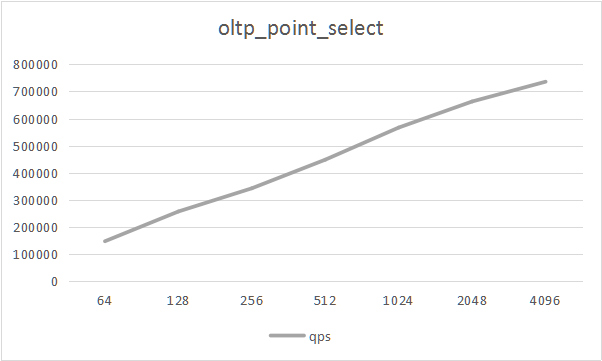
- oltp_point_select
| type | thread | tps | qps | min latency | avg latency | 95th latency | max latency |
|---|---|---|---|---|---|---|---|
| point_select | 64 | 148098.00 | 148098.00 | 0.26 | 0.43 | 0.52 | 276.54 |
| point_select | 128 | 257760.00 | 257760.00 | 0.27 | 0.50 | 0.65 | 261.51 |
| point_select | 256 | 343215.00 | 343215.00 | 0.28 | 0.75 | 1.89 | 253.23 |
| point_select | 512 | 448683.00 | 448683.00 | 0.29 | 1.14 | 3.55 | 290.85 |
| point_select | 1024 | 567063.00 | 567063.00 | 0.30 | 1.80 | 5.57 | 70.21 |
| point_select | 2048 | 663217.00 | 663217.00 | 0.29 | 3.08 | 8.90 | 330.19 |
| point_select | 4096 | 736094.00 | 736094.00 | 0.33 | 5.55 | 15.00 | 431.72 |
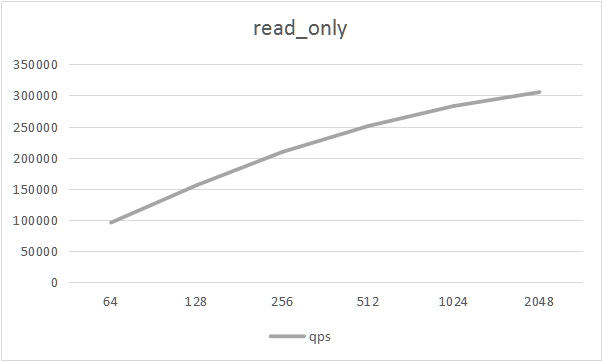
- read_only
| type | thread | tps | qps | min latency | avg latency | 95th latency | max latency |
|---|---|---|---|---|---|---|---|
| read_only | 64 | 5984.48 | 95751.60 | 7.87 | 10.69 | 14.21 | 85.24 |
| read_only | 128 | 9741.39 | 155862.00 | 7.64 | 13.14 | 18.28 | 236.37 |
| read_only | 256 | 13080.20 | 209284.00 | 9.22 | 19.56 | 28.16 | 99.79 |
| read_only | 512 | 15678.40 | 250854.00 | 10.40 | 32.62 | 49.34 | 115.78 |
| read_only | 1024 | 17691.40 | 283063.00 | 10.87 | 57.73 | 87.56 | 378.12 |
| read_only | 2048 | 19086.60 | 305386.00 | 7.68 | 107.12 | 164.45 | 710.91 |
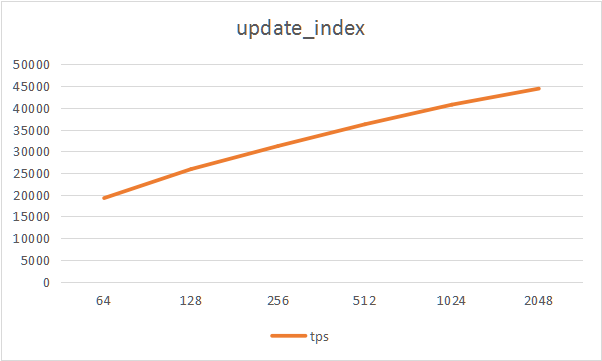
- oltp_update_index
| type | thread | tps | qps | min latency | avg latency | 95th latency | max latency |
|---|---|---|---|---|---|---|---|
| update_index | 64 | 19232.10 | 19232.10 | 1.75 | 3.33 | 4.74 | 274.86 |
| update_index | 128 | 25898.20 | 25898.20 | 1.67 | 4.94 | 7.98 | 330.88 |
| update_index | 256 | 31214.00 | 31214.00 | 1.67 | 8.20 | 14.73 | 5189.46 |
| update_index | 512 | 36213.50 | 36213.50 | 1.74 | 14.13 | 27.66 | 5487.91 |
| update_index | 1024 | 40731.20 | 40731.20 | 1.74 | 25.12 | 52.89 | 7395.50 |
| update_index | 2048 | 44423.50 | 44423.50 | 1.77 | 46.04 | 99.33 | 5563.36 |
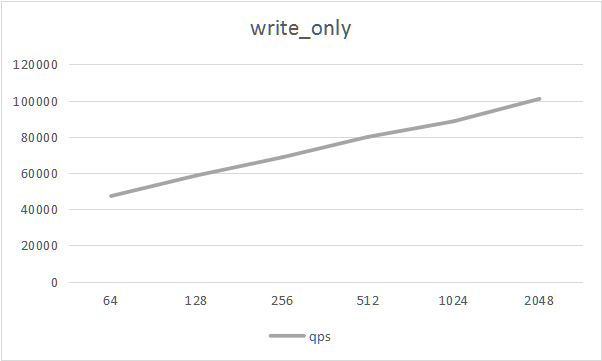
- write_only
| type | thread | tps | qps | min latency | avg latency | 95th latency | max latency |
|---|---|---|---|---|---|---|---|
| write_only | 64 | 7882.92 | 47297.50 | 3.05 | 8.12 | 12.52 | 341.78 |
| write_only | 128 | 9780.01 | 58680.10 | 3.07 | 13.08 | 21.50 | 504.41 |
| write_only | 256 | 11450.20 | 68701.20 | 3.12 | 22.34 | 36.89 | 6874.97 |
| write_only | 512 | 13330.00 | 79979.20 | 3.04 | 38.39 | 65.65 | 6316.33 |
| write_only | 1024 | 14761.20 | 88567.40 | 3.30 | 68.39 | 118.92 | 5426.65 |
| write_only | 2048 | 16825.20 | 100951.00 | 3.25 | 121.50 | 223.34 | 5551.31 |
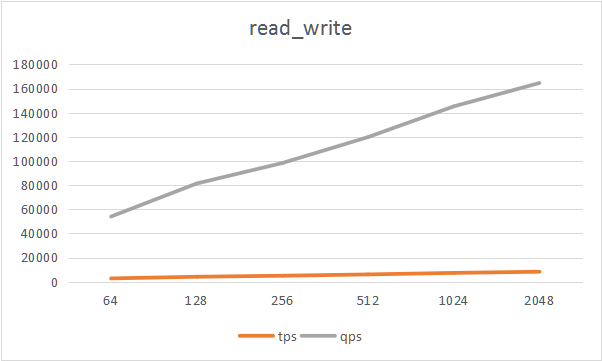
- read_write
| type | thread | tps | qps | min latency | avg latency | 95th latency | max latency |
|---|---|---|---|---|---|---|---|
| read_write | 64 | 2698.01 | 53960.20 | 13.91 | 23.72 | 29.72 | 321.56 |
| read_write | 128 | 4066.40 | 81328.10 | 12.19 | 31.47 | 42.85 | 411.31 |
| read_write | 256 | 4915.23 | 98304.50 | 12.94 | 52.06 | 70.55 | 626.57 |
| read_write | 512 | 5988.96 | 119779.00 | 12.99 | 85.42 | 121.08 | 5023.20 |
| read_write | 1024 | 7260.19 | 145204.00 | 13.25 | 140.67 | 196.89 | 5767.52 |
| read_write | 2048 | 8228.84 | 164577.00 | 13.96 | 248.19 | 376.49 | 5475.98 |
3.1.3 总结
由于 TiDB 与 MySQL 在体系架构上的差别非常大,很多方面都很难找到一个共同的基准点,所以大家不要消耗过多精力在这类基准测试上,应该更多关注 TiDB 和 MySQL 在应用程序使用场景上的区别。MySQL 读扩容可以通过添加从库进行扩展,但单节点写入不具备扩展能力只能通过分库分表,而分库分表会增加开发维护方面成本。TiDB 不管是读流量还是写流量都可以通过添加节点的方式进行快速方便的扩展。
TiDB 设计的目标就是针对 MySQL 单台容量限制而被迫做出分库分表的场景,或者需要强一致性和完整分布式事务的场景。它的优势是通过尽量将并行计算下推到各个存储节点。对于小表(比如千万级以下)不适合 TiDB。因为数据量少导致表的 region 数量有限,发挥不了并行计算的优势。最极端的就是计数器表,几行记录高频更新,会变成存储引擎上的几个 KV 高频更新,然后数据都存储在一个 region 里,而这个 region 的流量都在一个计算节点上,再加上后台强一致性复制的开销,以及 TiDB 到 TiKV 的开销,最后表现出来的就是没有单个 MySQL 好。